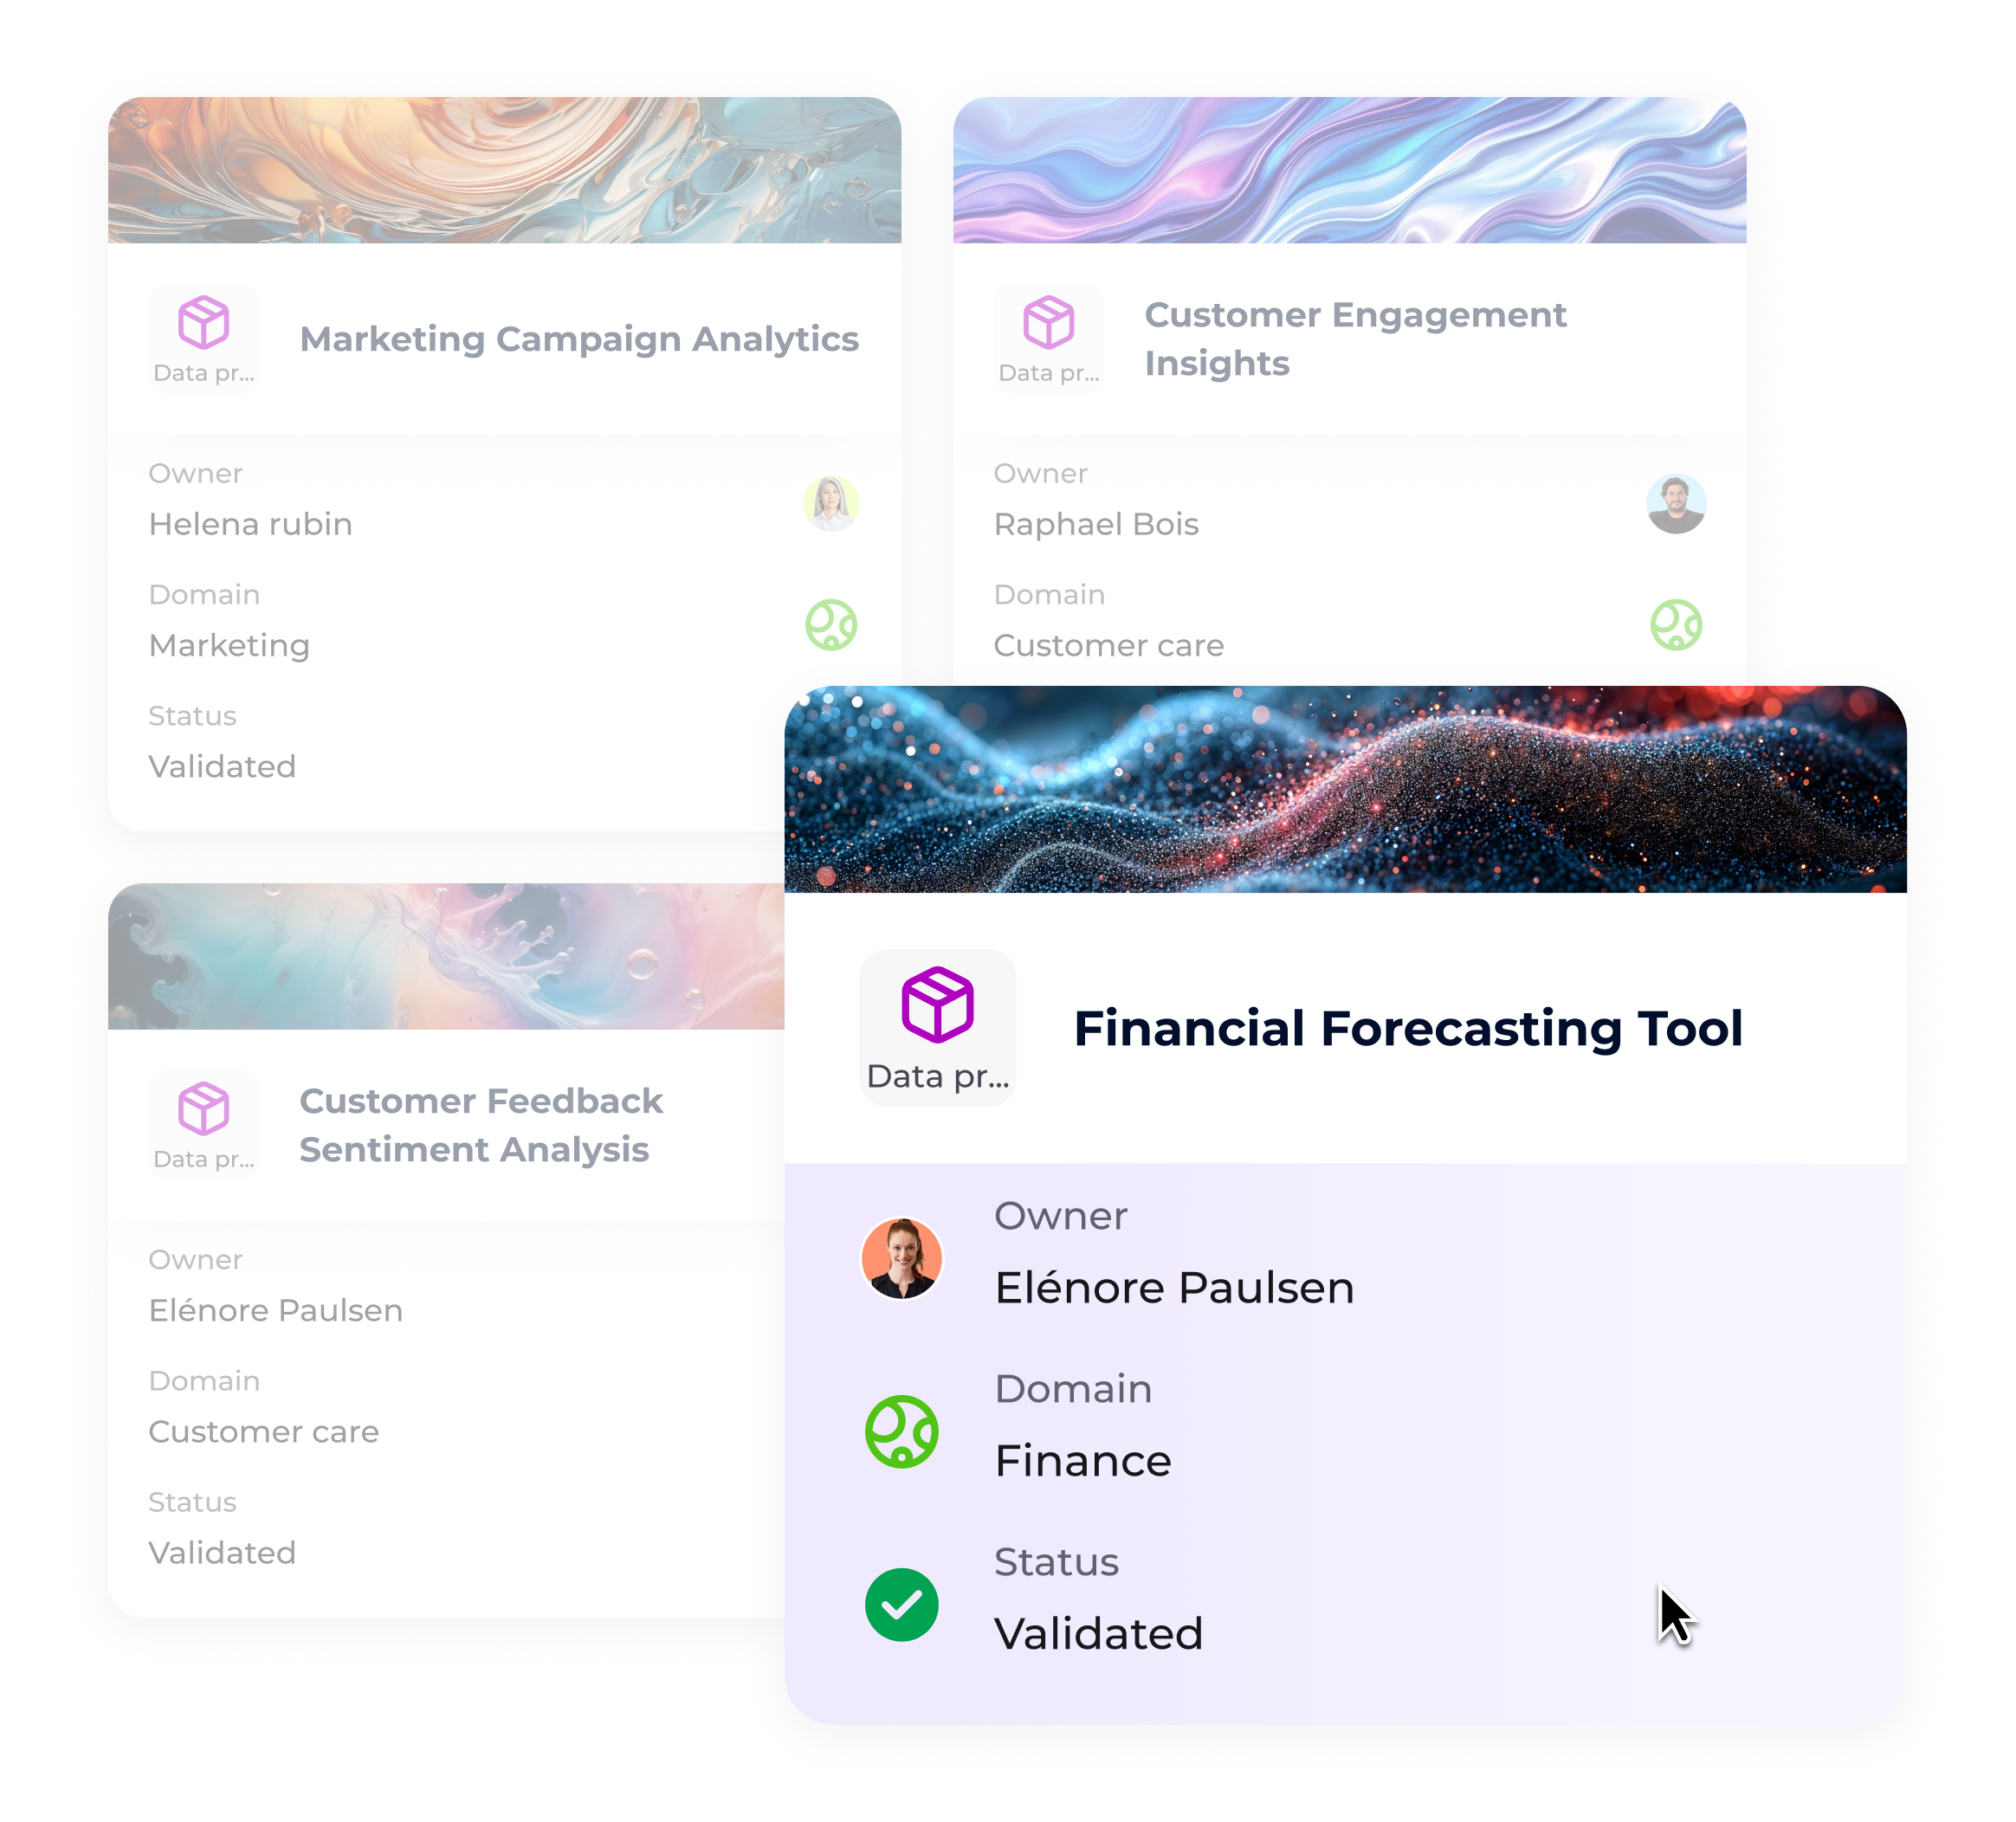

Data Products
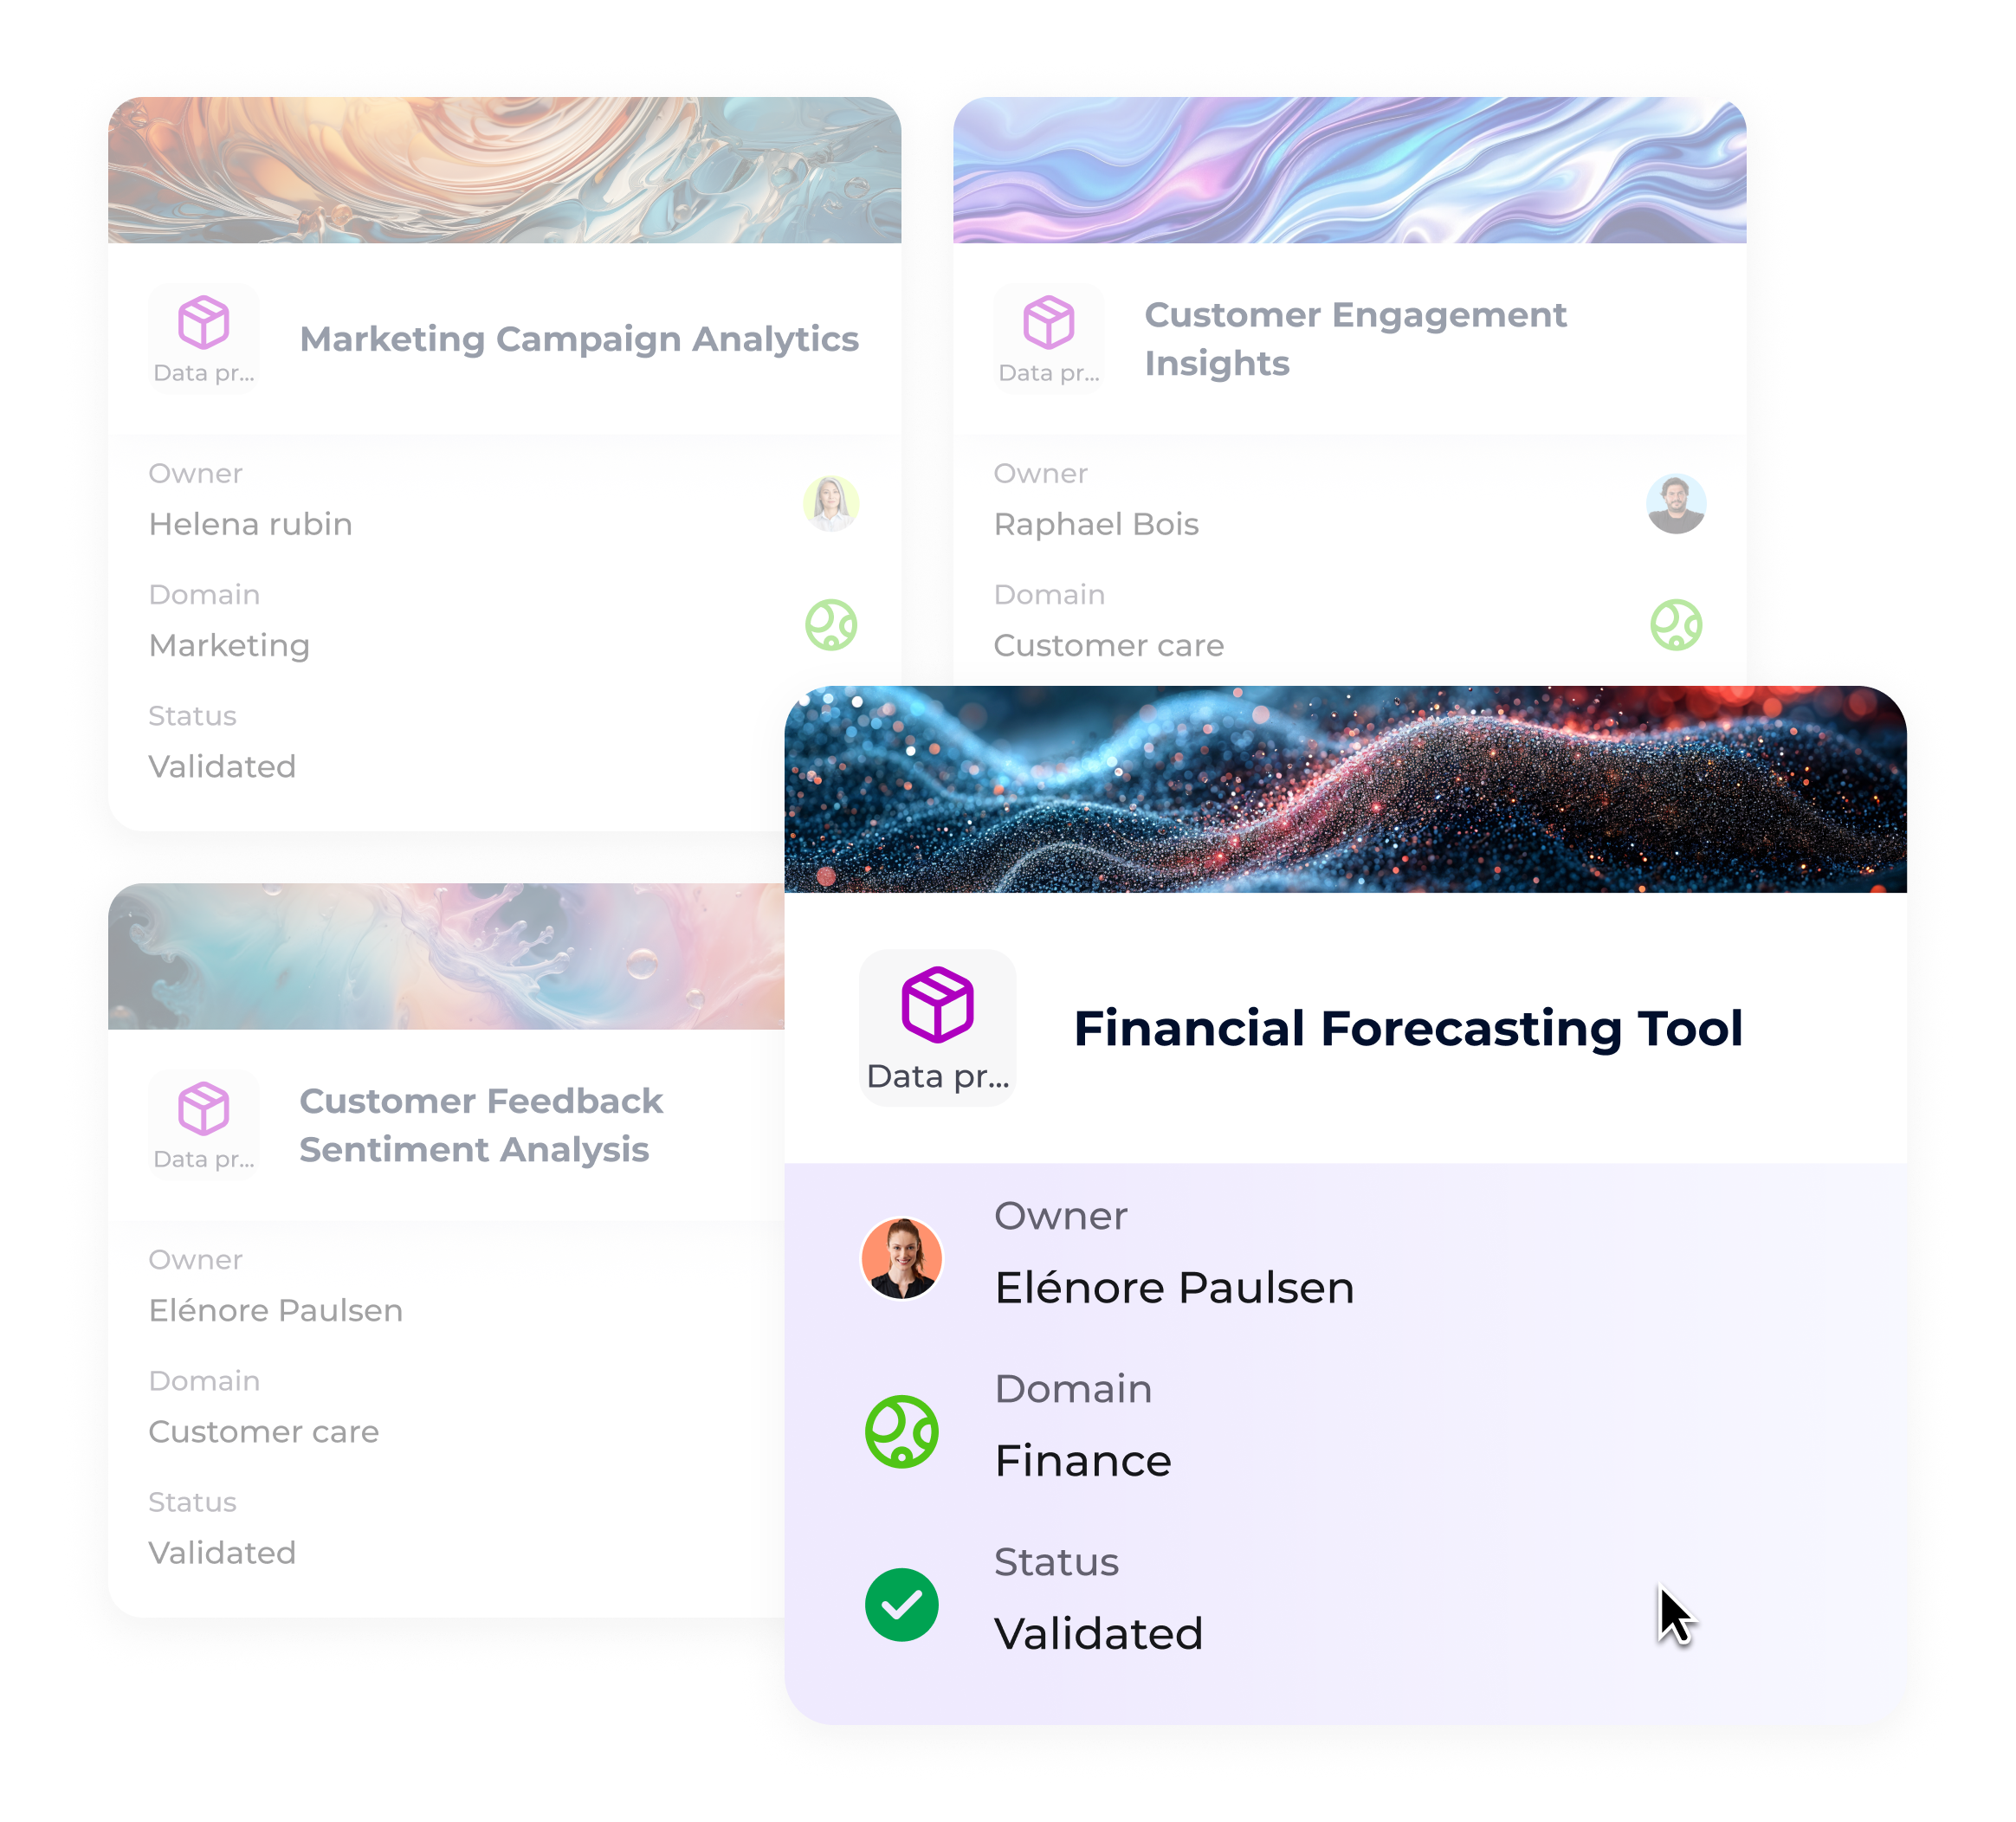
The Data Product module is designed to transform data assets into structured, usable products. It enables teams to describe, document and share datasets, pipelines or analyses as consumable resources through a dedicated interface.
The goal is to make data more accessible and understandable, helping bridge the gap between technical and business users and supporting better decision-making.
-
In many organisations, data is abundant but remains difficult to use effectively.
For business users:
Difficulty identifying which data can meet their needs
Lack of context to understand the value and use of the data
Lack of a clear vision of concrete applications
For data teams:
Lack of a framework to structure and document their data assets
Difficulty promoting their work to business users
Lack of a standardised publication system

How might we …
Structure, document and distribute our Data Products via a Marketplace to facilitate their discovery and consumption by business units?
UX Approach
This project was carried out in collaboration with two other product designers, working closely to define a consistent and cohesive experience.
1. Discovery & User Interviews
User research was conducted through qualitative interviews with several organisations to better understand their needs and and how familiar they are with Data Products.
We found different levels of maturity across organisations


We are not yet mature enough to embark on this process, but we can see the potential for better structuring our business needs.

It is really the metadata surrounding the data that matters.

2. Design principles
Four main principles guided our design:
Business-centric
Put business users first
End-to-end journey
Cover the full experience, from discovery to use
Data consistency
Keep clear connections between objects
Scalability
Build the foundation for a marketplace that can grow over time
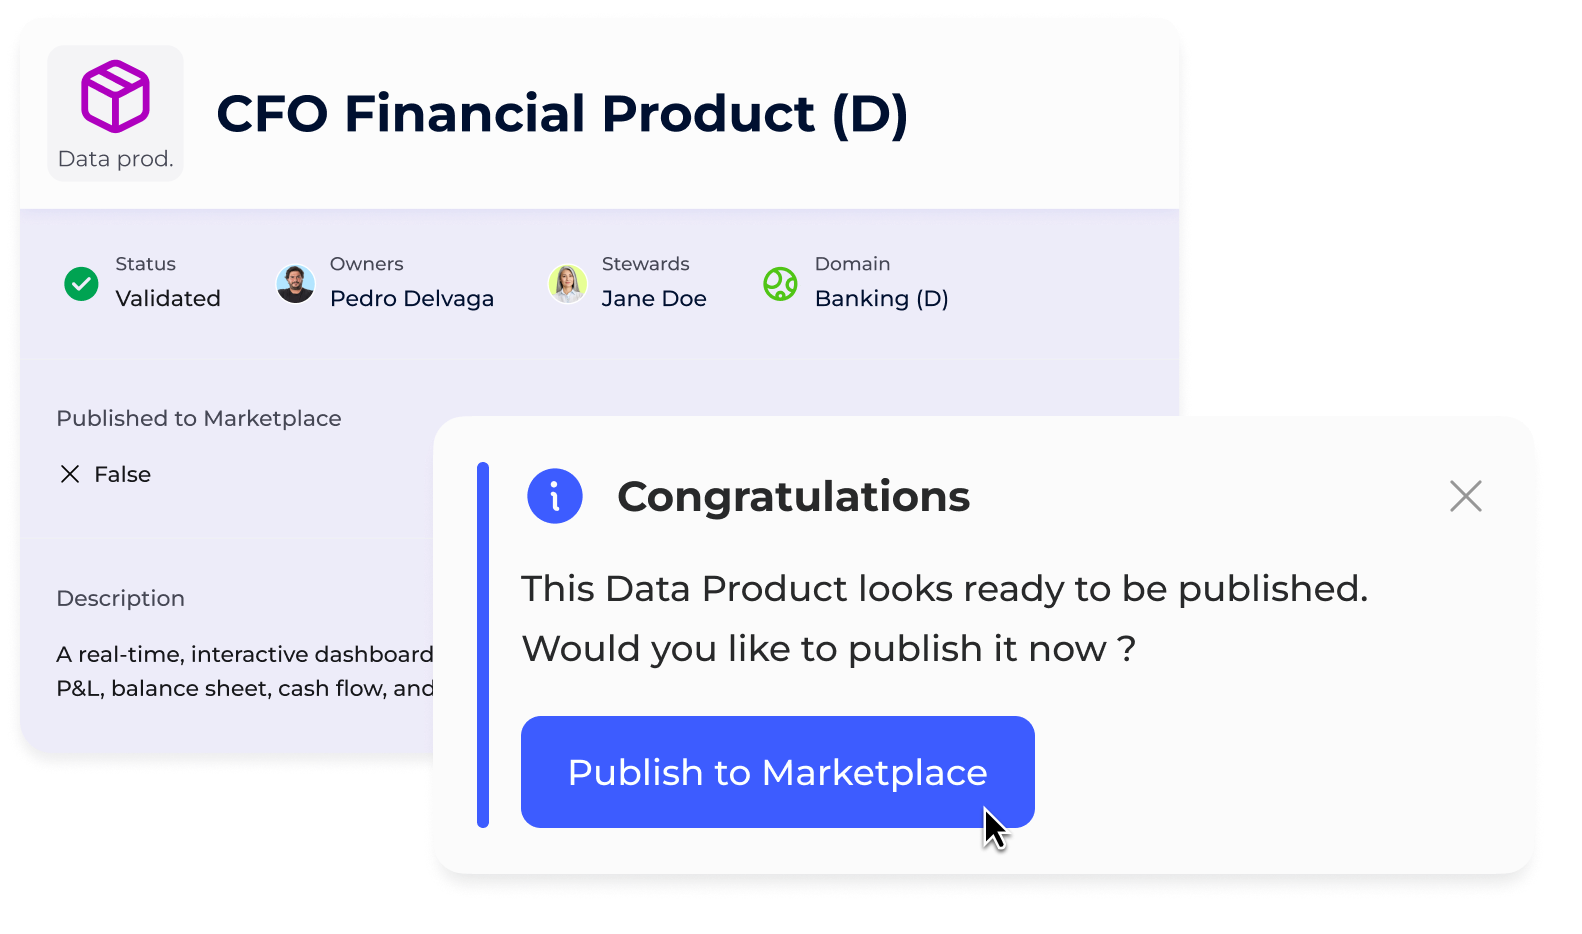
Mockups were created collaboratively to explore key user flows such as discovering, exploring and publishing data products.
3. Product Evolution
During the project, the scope evolved to better address user needs, particularly around data accessibility.
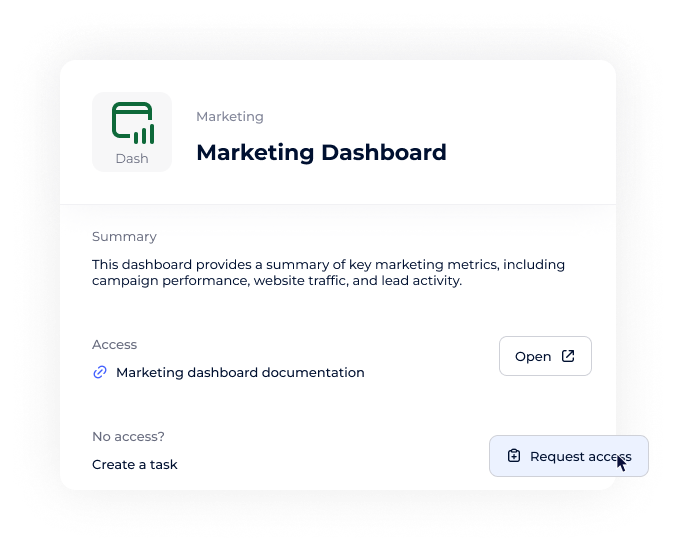
A key addition was the integration of output port to data directly within each product.
This allows users to understand how to retrieve and use the data in practice, moving beyond simple documentation toward actionable usage.
UI Phase
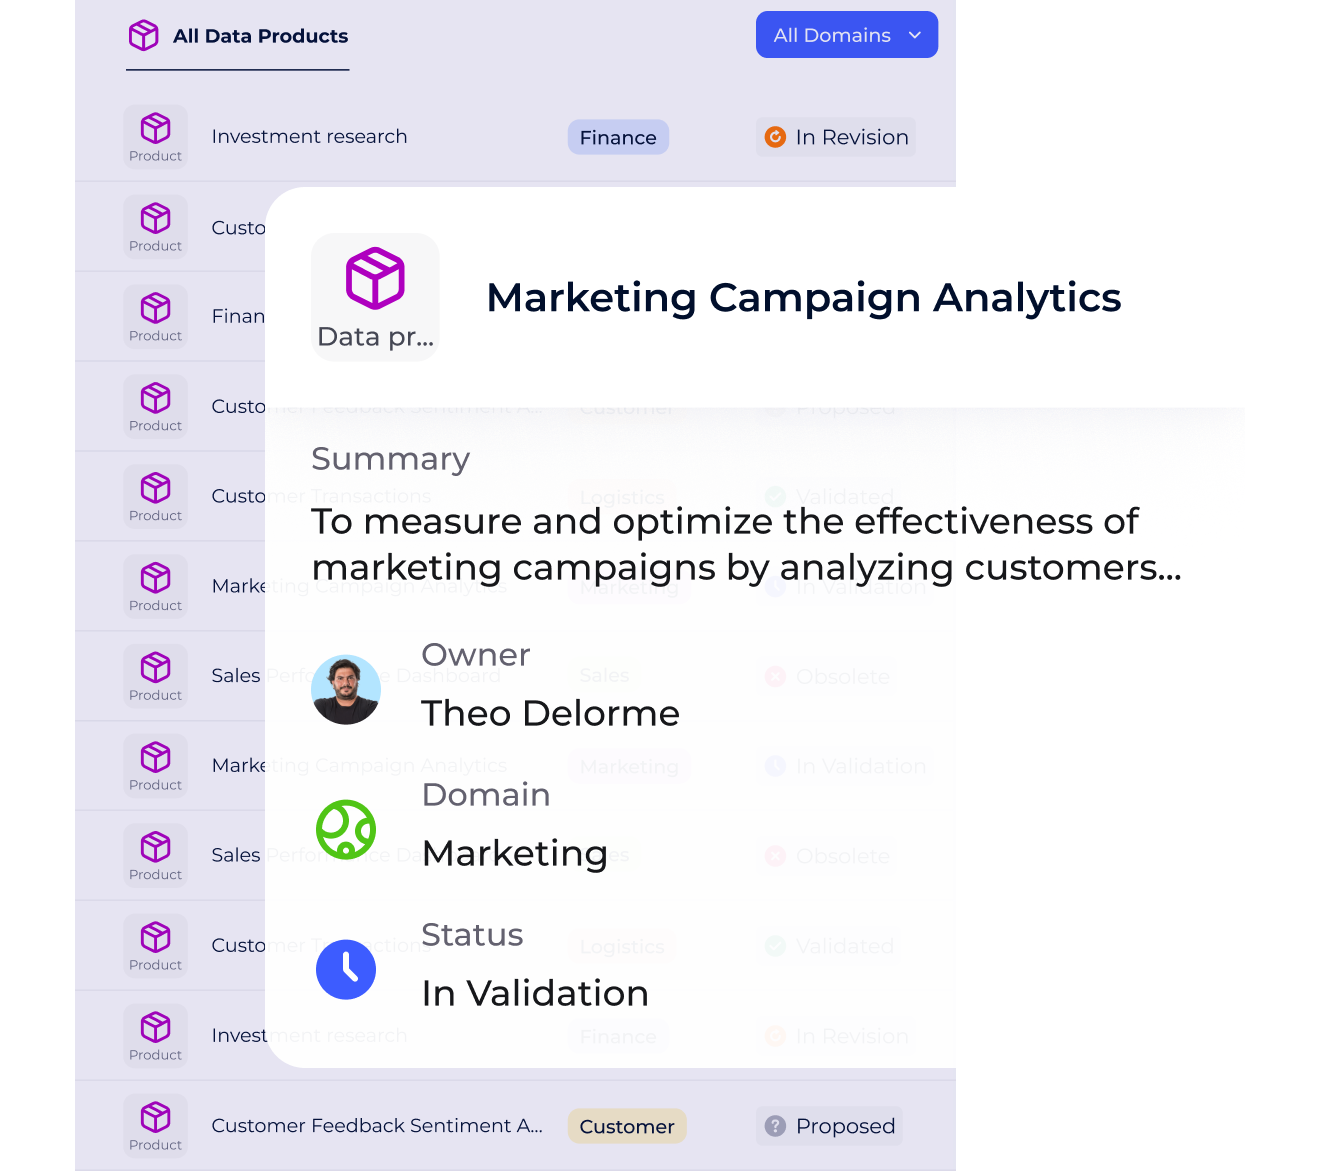
1. High-fidelity mock-ups
Design of final interfaces incorporating:
The DataGalaxy design system to ensure consistency
Feedback from the wireframing phases
Technical constraints identified with the engineering team
2. Prototyping
Interactive prototypes were developed to :
Test end-to-end flows
Validate usability
Identify friction points early
3. Demo
Presentation of prototypes to pilot customers to:
Validate the product approach and ergonomics with users
Collect iterative feedback
Adjust development priorities
Analyze impact
The Data Product & Marketplace module has bridged the gap between technical and business teams, making data not only accessible, but above all understandable and usable.
Results
Increased adoption by business users thanks to a more intuitive and business-centric approach
Gradual formalisation of data products in client organisations
Reduction in search time and increased confidence in data
Keep reading
More examples of design that drives results.